Mobiquity / Under Armour
Under Armour® Record app dashboard
An internal analytics dashboard for tracking user behavior in Under Armour's Record app.
- Problem
- Under Armour had a lot of user data from its Record app but no useful way to analyze or display it, including how social media content related to app traffic.
- My role
- UI designer at Mobiquity, working with the Under Armour team to pick the most useful statistics and design a custom version of Mobiquity's behavior change platform.
- Key decisions
- Surfaced data combinations the team wasn't already looking at.
- Used a single accent color to highlight the most important figures.
- Set the hierarchy through size, contrast, and color for a clear overview.
- Outcome
- Delivered as an internal dashboard that gave the team an at-a-glance read before drilling into detail.
Context
UI Designer · 2014
Services: UI design · User & pattern research · Client data analysis · Copywriting
Typefaces: Kepler and Roboto Slab
Summary of work
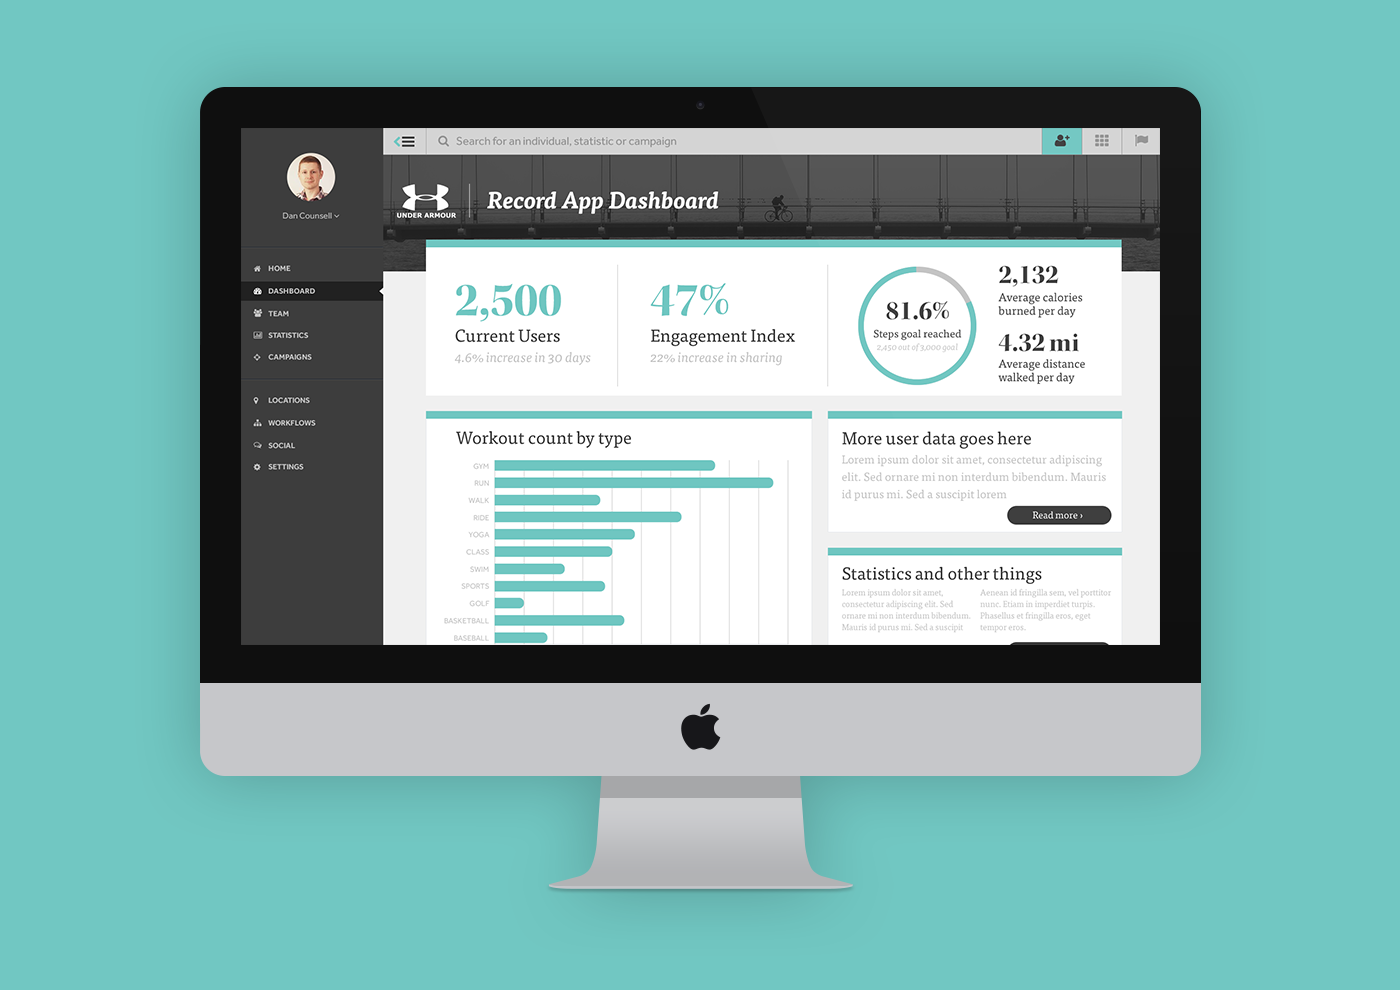
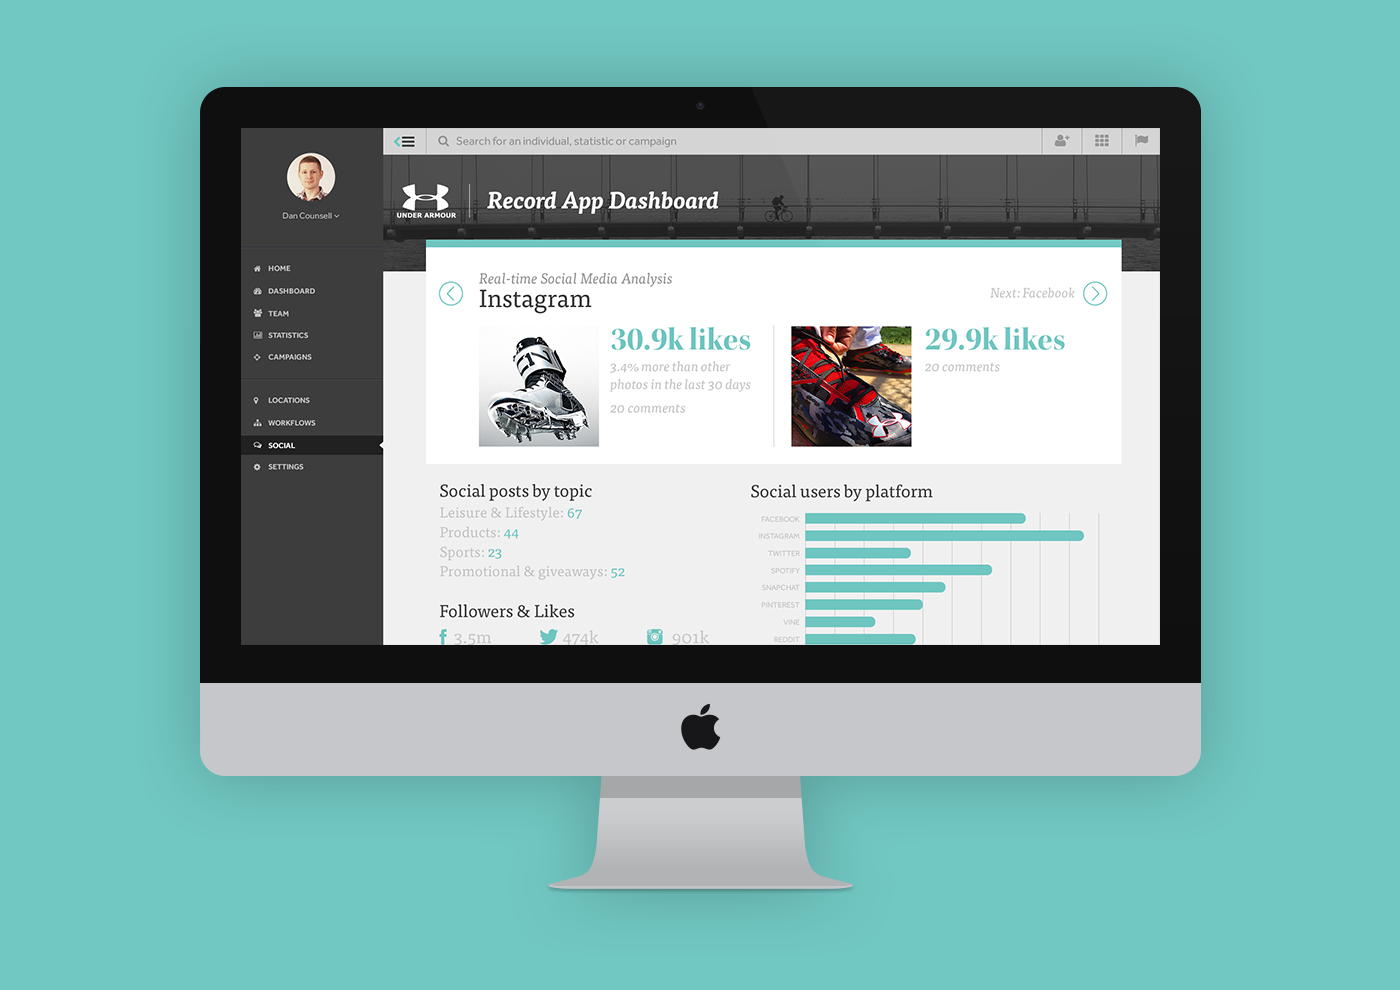
This analytics dashboard was created as a customized product for Under Armour® to track and analyze users in their Record app. It was an internal tool — a personalized version of Mobiquity's in-house behavioral change platform, refactored for clients who needed deeper insight into their users' behaviors and usage statistics. A key goal was highlighting the relationship between social media content and user traffic to and from the app.
Problem
The team at Under Armour® had substantial user data but no way to analyze and display it in a form that was actually useful to their team. Raw data without the right interface is just noise — the challenge was giving them a tool that made patterns visible and actionable.
Process
I worked with the Under Armour team to identify the statistics that would help them most, and to surface combinations of data they weren't already looking at — giving them deeper insight than their existing reporting provided. My goal was a clean, visual dashboard that offered a clear overview without being overwhelming.
Outcomes & impact
The final dashboard used a single accent color to highlight important figures, so users could get an at-a-glance read on their dashboard before drilling into detail. Visual hierarchy was established through size, contrast, and color — creating a more digestible overview of the data and a tool the team could actually use day-to-day.
Learnings
Performance and clarity are not opposites in UI design, but achieving both simultaneously takes deliberate effort. The temptation with a brand like Under Armour is to apply maximum intensity everywhere — but data dashboards require visual hierarchy, and hierarchy requires range. Learning to deploy brand intensity strategically rather than uniformly was the key design lesson from this project.